
Tutorial 5 - Using Google Fusion to create heatmaps
Follow this example in order to learn how to upload your postcodes into Google Fusion and view them as a heatmap. You will need a file of postcodes with easting and northing values and population counts in plain text format in order to complete this tutorial.
Example Test File
example-4-cambridge.csv
Stage 1: Preparing Google Fusion
- Go to drive.google.com and sign into your Google account (you can create an account here if you don't already have one).
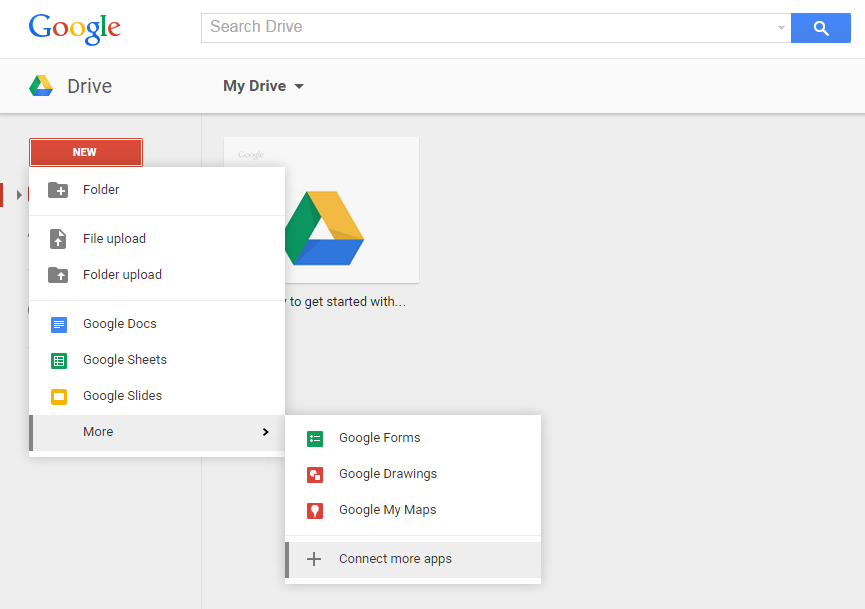
- In the left-hand pane, click 'NEW' -> 'More' -> 'Connect more apps'.
- Type 'fusion tables' in the Search Apps box and hit Enter.
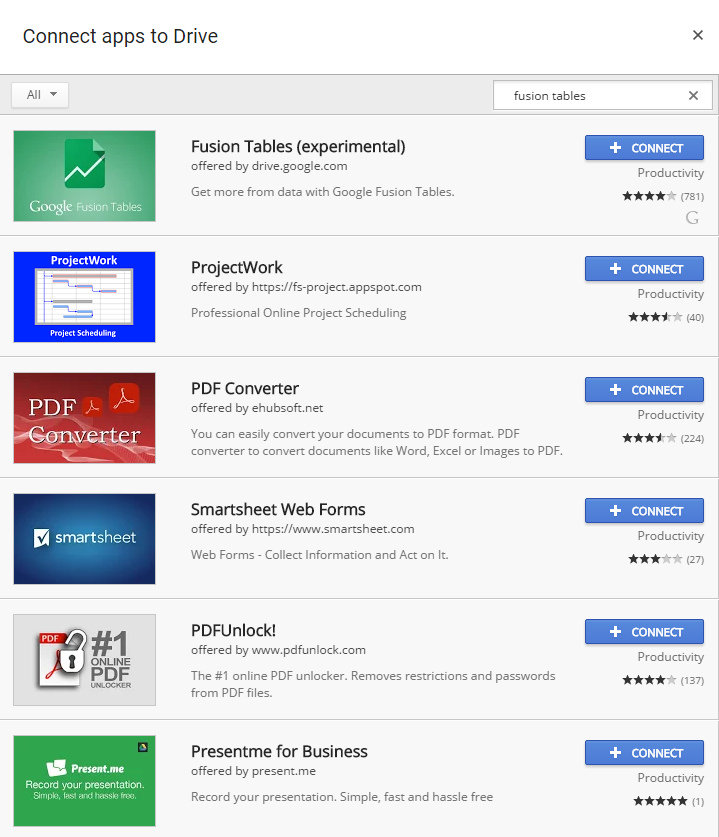
- Click the '+ CONNECT' button and then 'OK'.
Stage 2: Creating a Google Fusion table
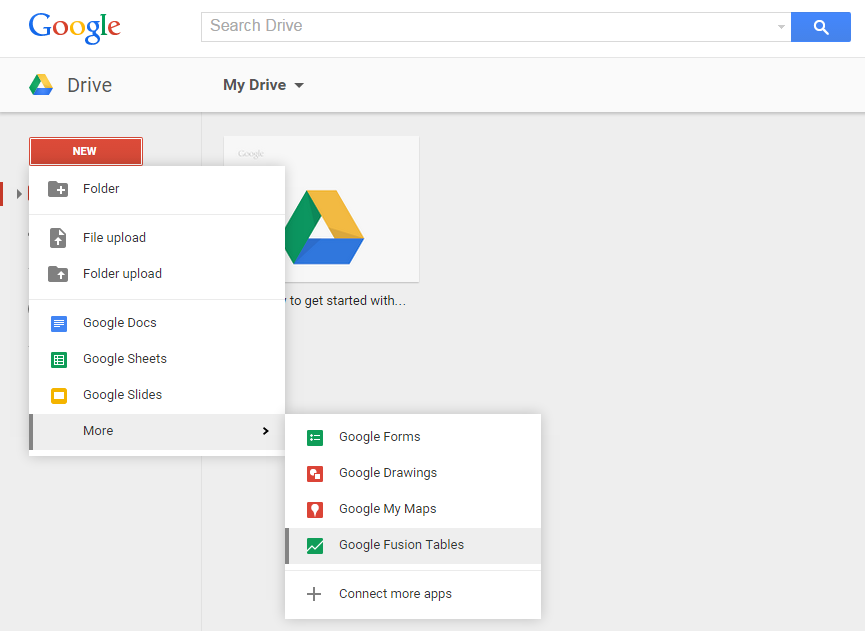
- Click 'NEW' -> 'More' -> 'Google Fusion Tables'.
- In the 'Import new table' dialog box, click 'Choose file' and select the CSV file.
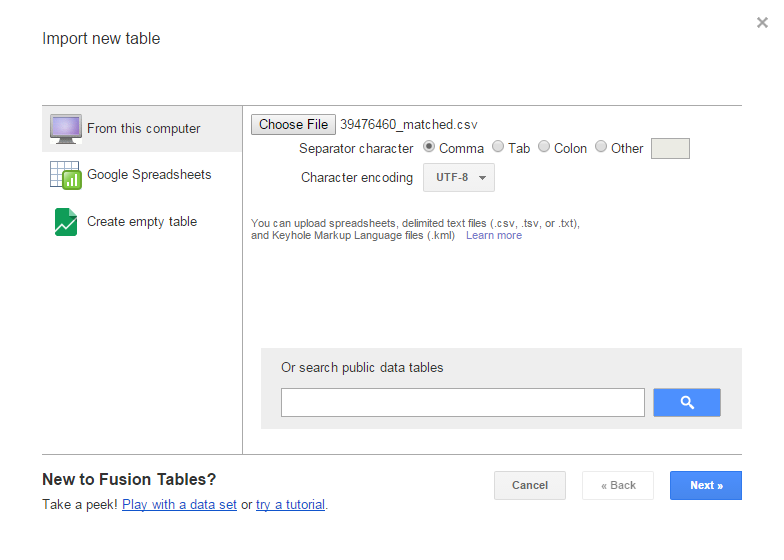
- Click 'Next' to review, 'Next' again to advance, and finally 'Finish'.
- Click the 'Map of...' tab to view the data. You might find that Google hasn't matched the points to the correct area. If this is the case, you can click 'Location' in the left-hand pane and select 'Postcode' to re-geocode the points.
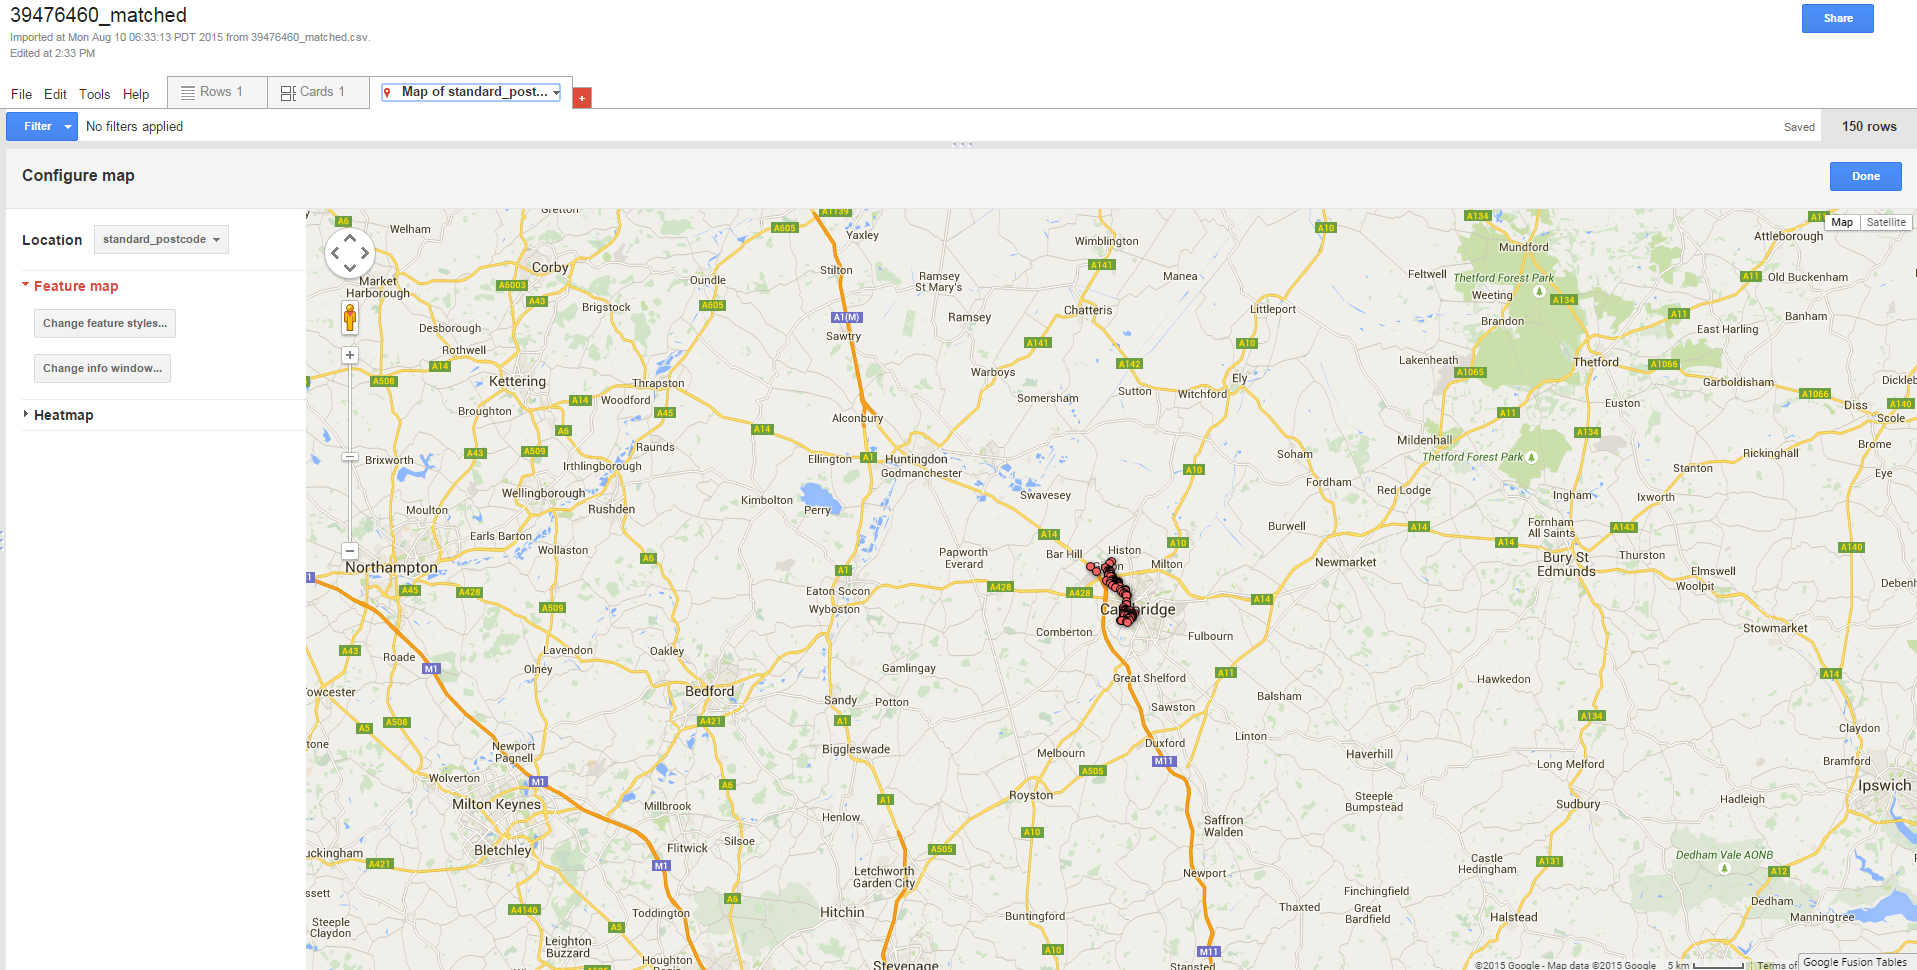
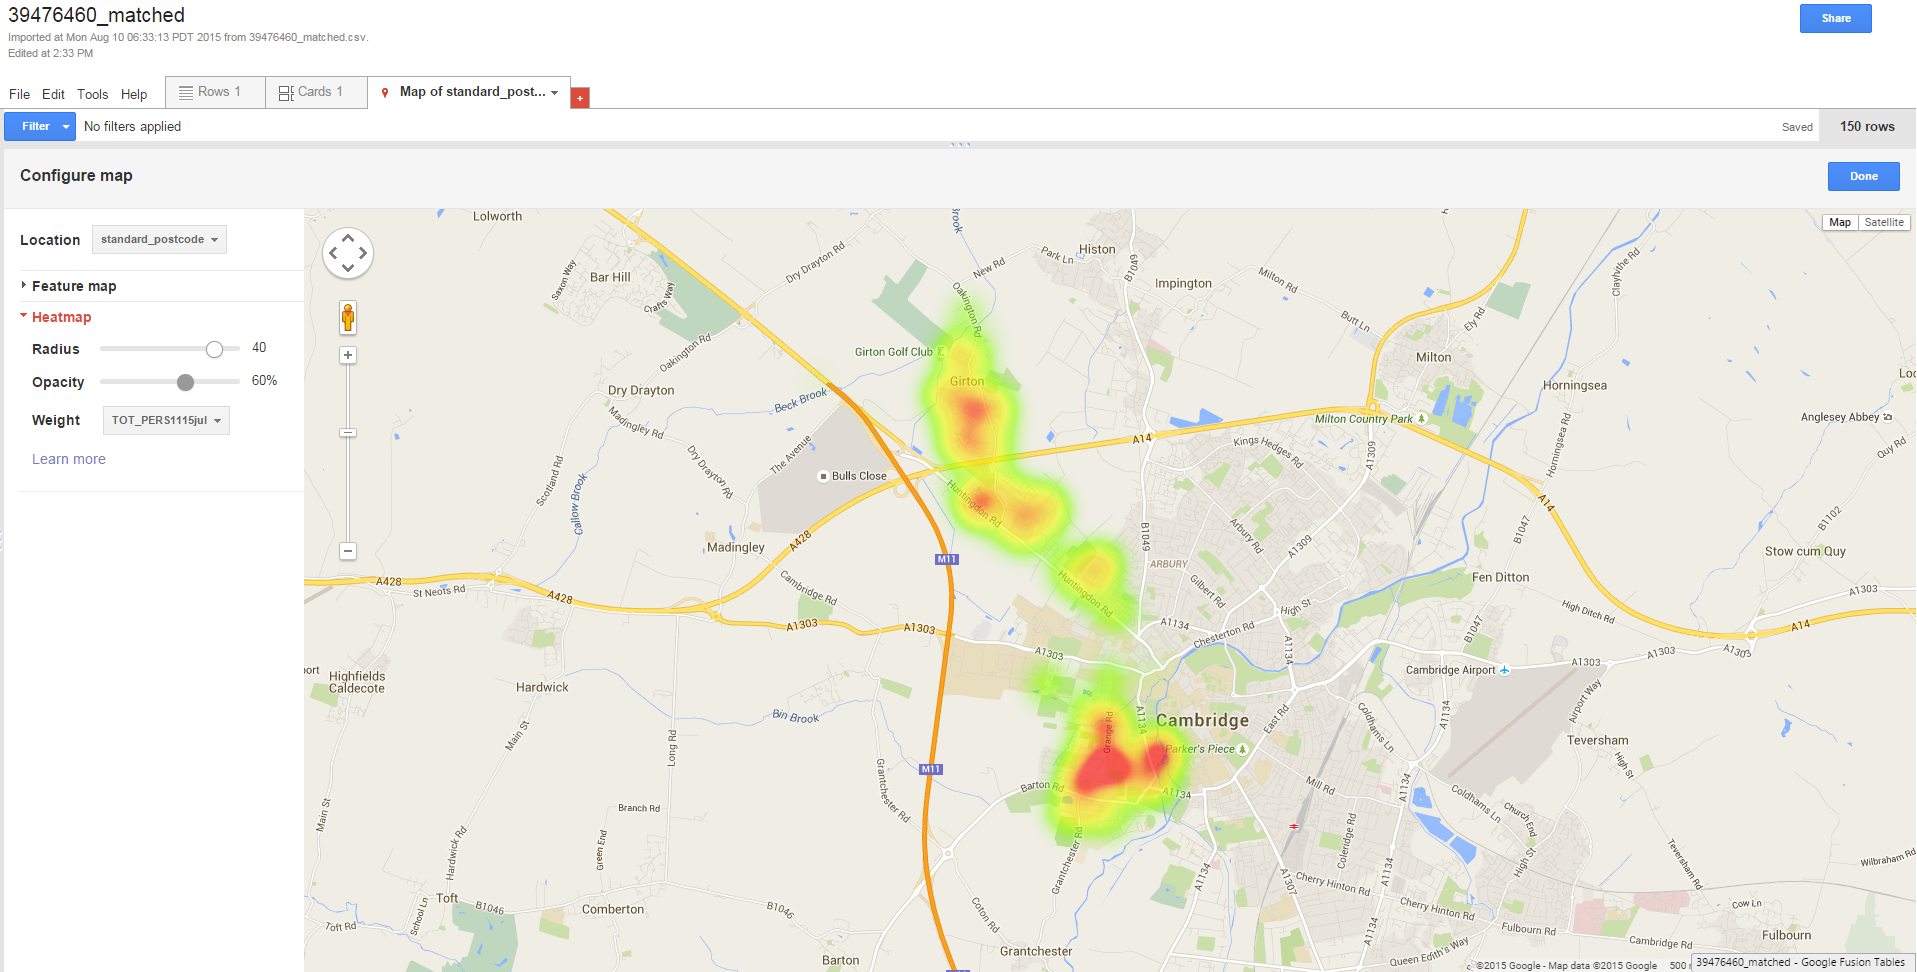
- Clicking on 'Heatmap' in the left-hand pane enables you to view a heatmap of the area.
- You can choose 'Population' from the 'Weight' dropdown box to show the areas with the highest populations.
- You can change the Radius and Opacity to suit your preference. To share the map, click the 'Share' button in the top-right.