
Tutorial 4 - Using QGIS to map postcodes
Follow this example in order to learn how to install QGIS and map postcodes. You will need a file of postcodes with easting and northing values in plain text format in order to complete this tutorial.
Example Test File
example-4-cambridge.csv
The Problem
A civil servant wishes to map her local area to know where the highest concentration of people are so that their new services have the greatest impact on the local community. She has a text file containing the home postcodes and the corresponding latitude and longitude values along with their populations (Example Test File example_4_cambridge.csv is available above, right-click and choose 'Save target as...' or 'Save link as...') in order to be able to plot them on a GIS map.
Stage 1: Downloading and installing QGIS
Download your free copy of QGIS at the following link: www.qgis.org/en/site/forusers/download.html.
If you are running Windows 7 (or later) but are unsure whether you require the 32-bit or 64-bit version, please see the FAQ here.
Once fully installed, open QGIS Desktop from the Start menu.
Stage 2: Preparing and viewing data in QGIS
- On the menu bar, click 'Plugins' -> 'Manage and install plugins'.
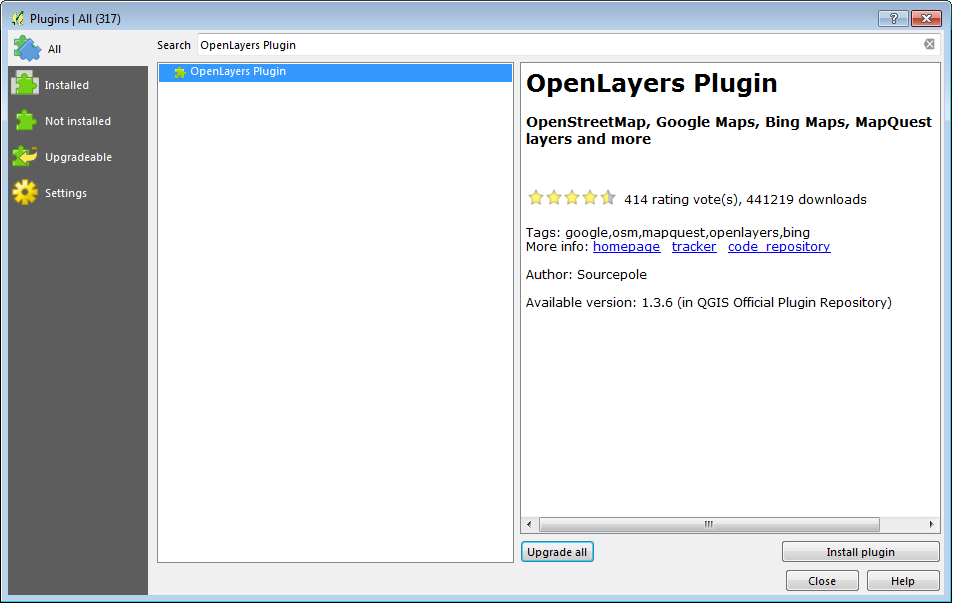
- Type 'OpenLayers Plugin' into the search bar and click the 'Install plugin' button. You can then close the Plugins window.
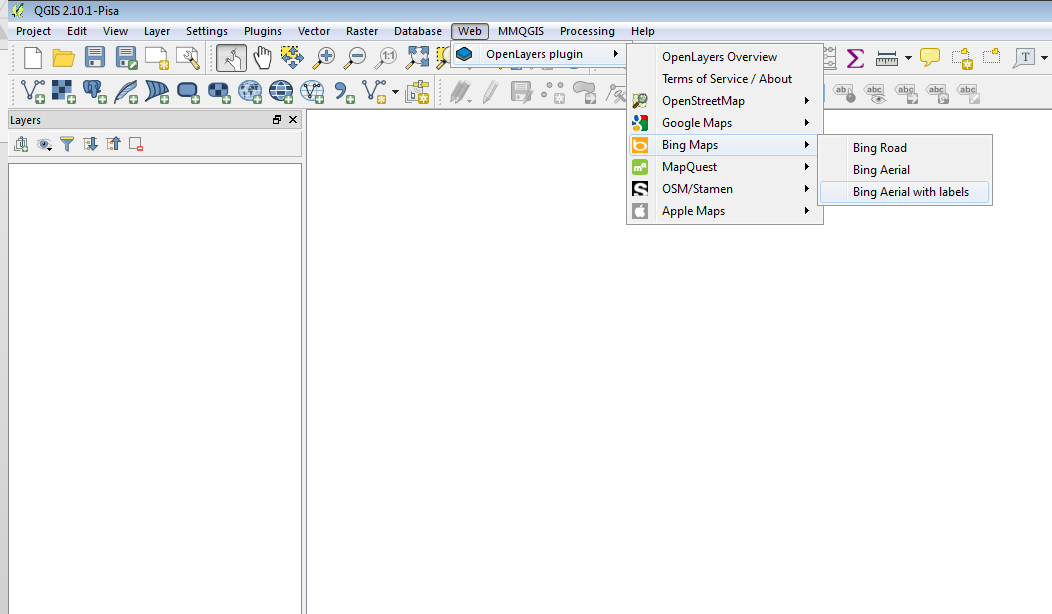
- On the menu bar again, click 'Web' -> 'OpenLayers plugin' -> 'Bing Maps' -> 'Bing Aerial with labels' to have the maps shown to give reference to the points.
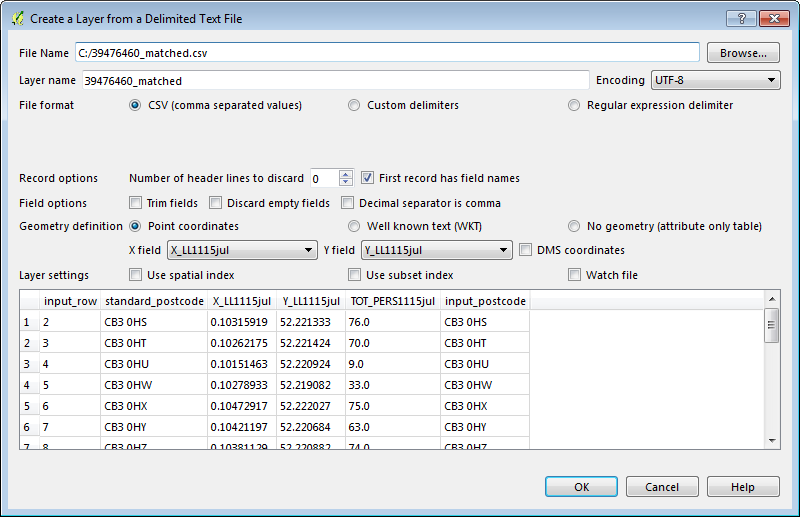
- Click the 'Add Delimited Text Layer' button on the toolbar.

- Browse for the downloaded file, make sure 'CSV' file format is checked and 'First record has field names' is checked.
- X and Y fields should be automatically selected so you can simply click 'OK'.
- It might be that the points are projected incorrectly and appear somewhere off the coast of Nigeria. If this is the case, you can fix this by right-clicking the CSV layer in the Layers Panel on the left-hand side and choosing 'Set Layer CRS'.
- Type 'EPSG:4326' into the Filter box and select the standard WGS 84 reference system and click 'OK'.
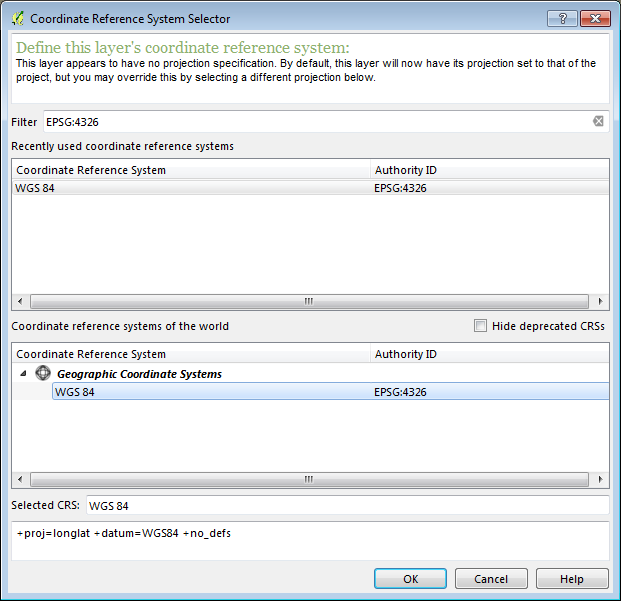
Essentially, these CRS projections are different methods of getting around the problem of viewing 3D points on a 2D screen when the curvature of the Earth can often create a distorted image. WGS 84 is the reference system currently used by all GPS devices.
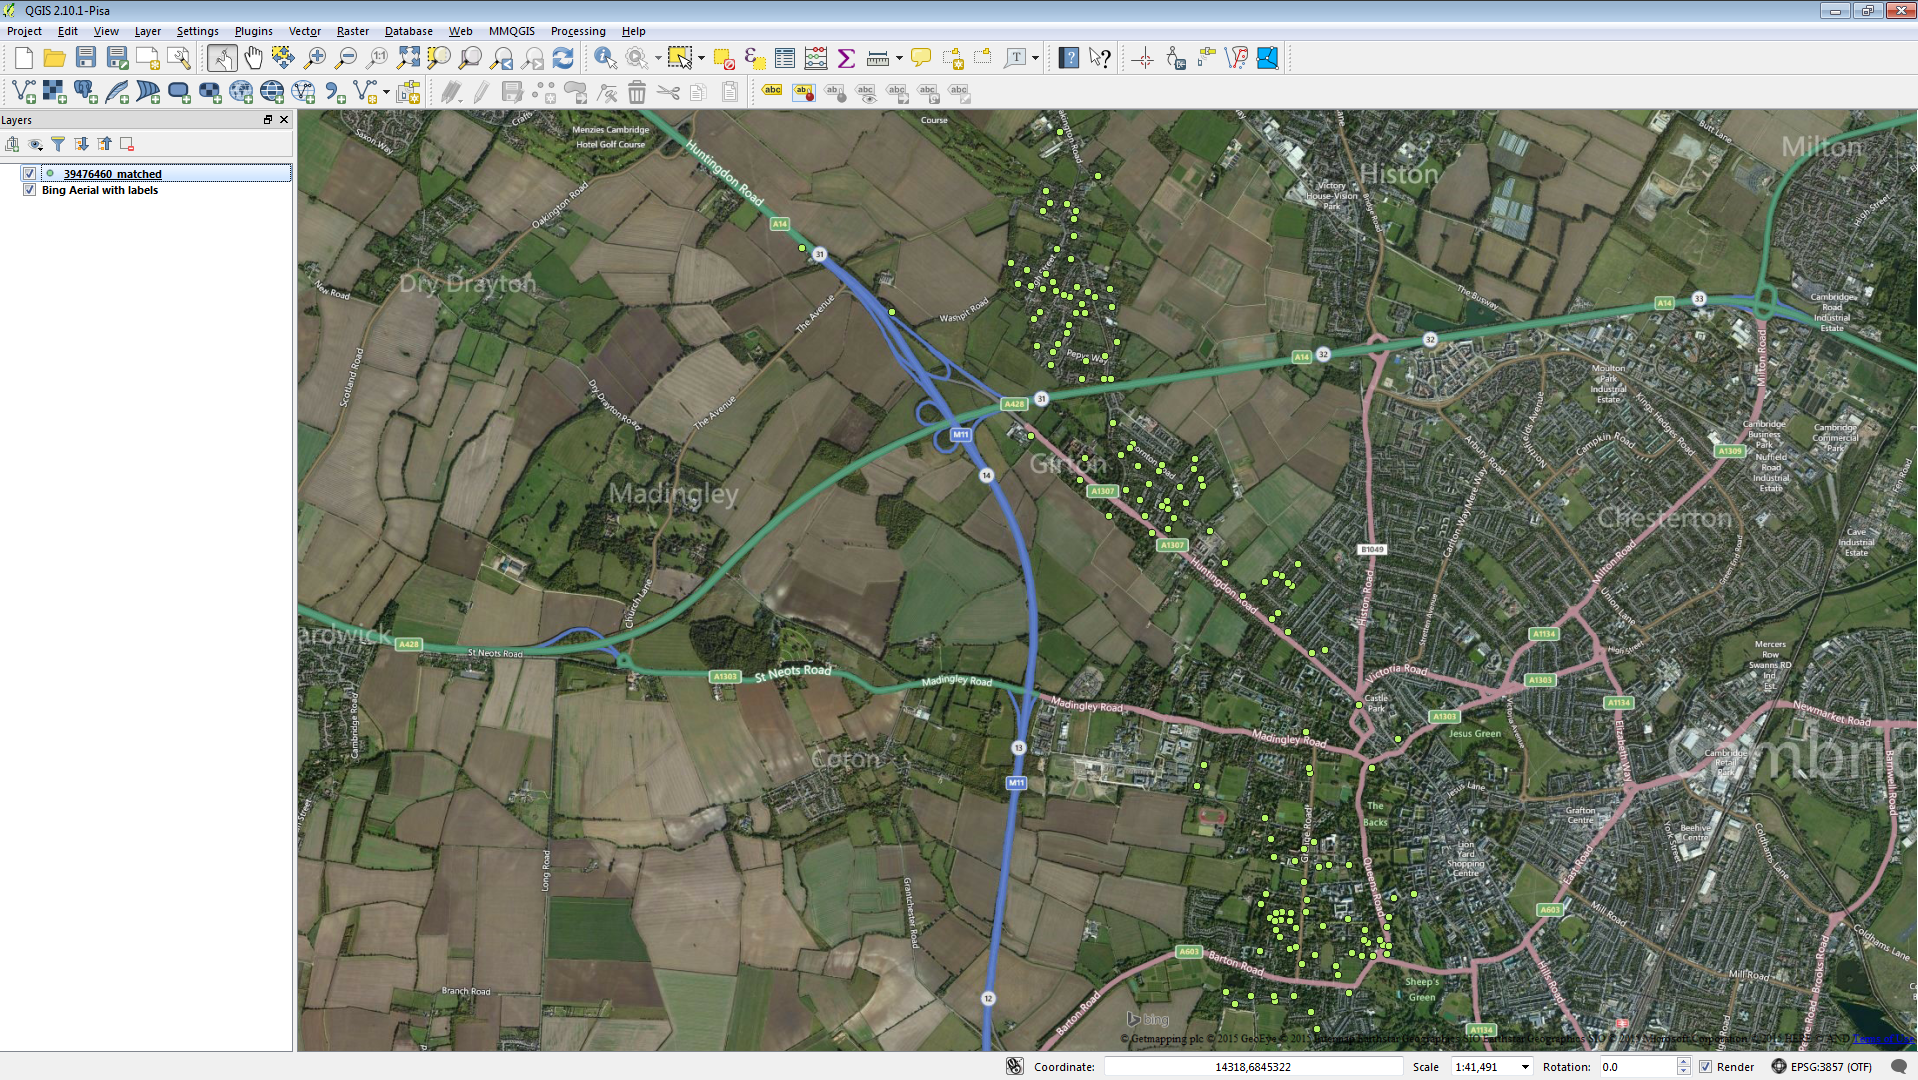
- Right-click the CSV layer in the Layers Panel and select 'Zoom to Layer'.
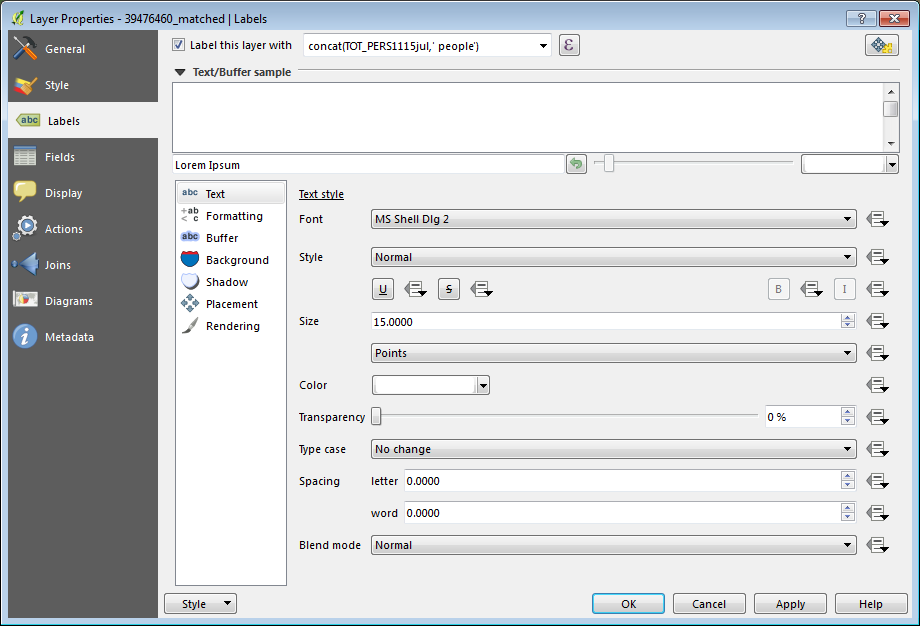
- To view the population information, right-click the CSV layer again and select 'Properties'.
- In the left-hand pane, choose 'Labels' and select 'Label this layer with' from the dropdown box.
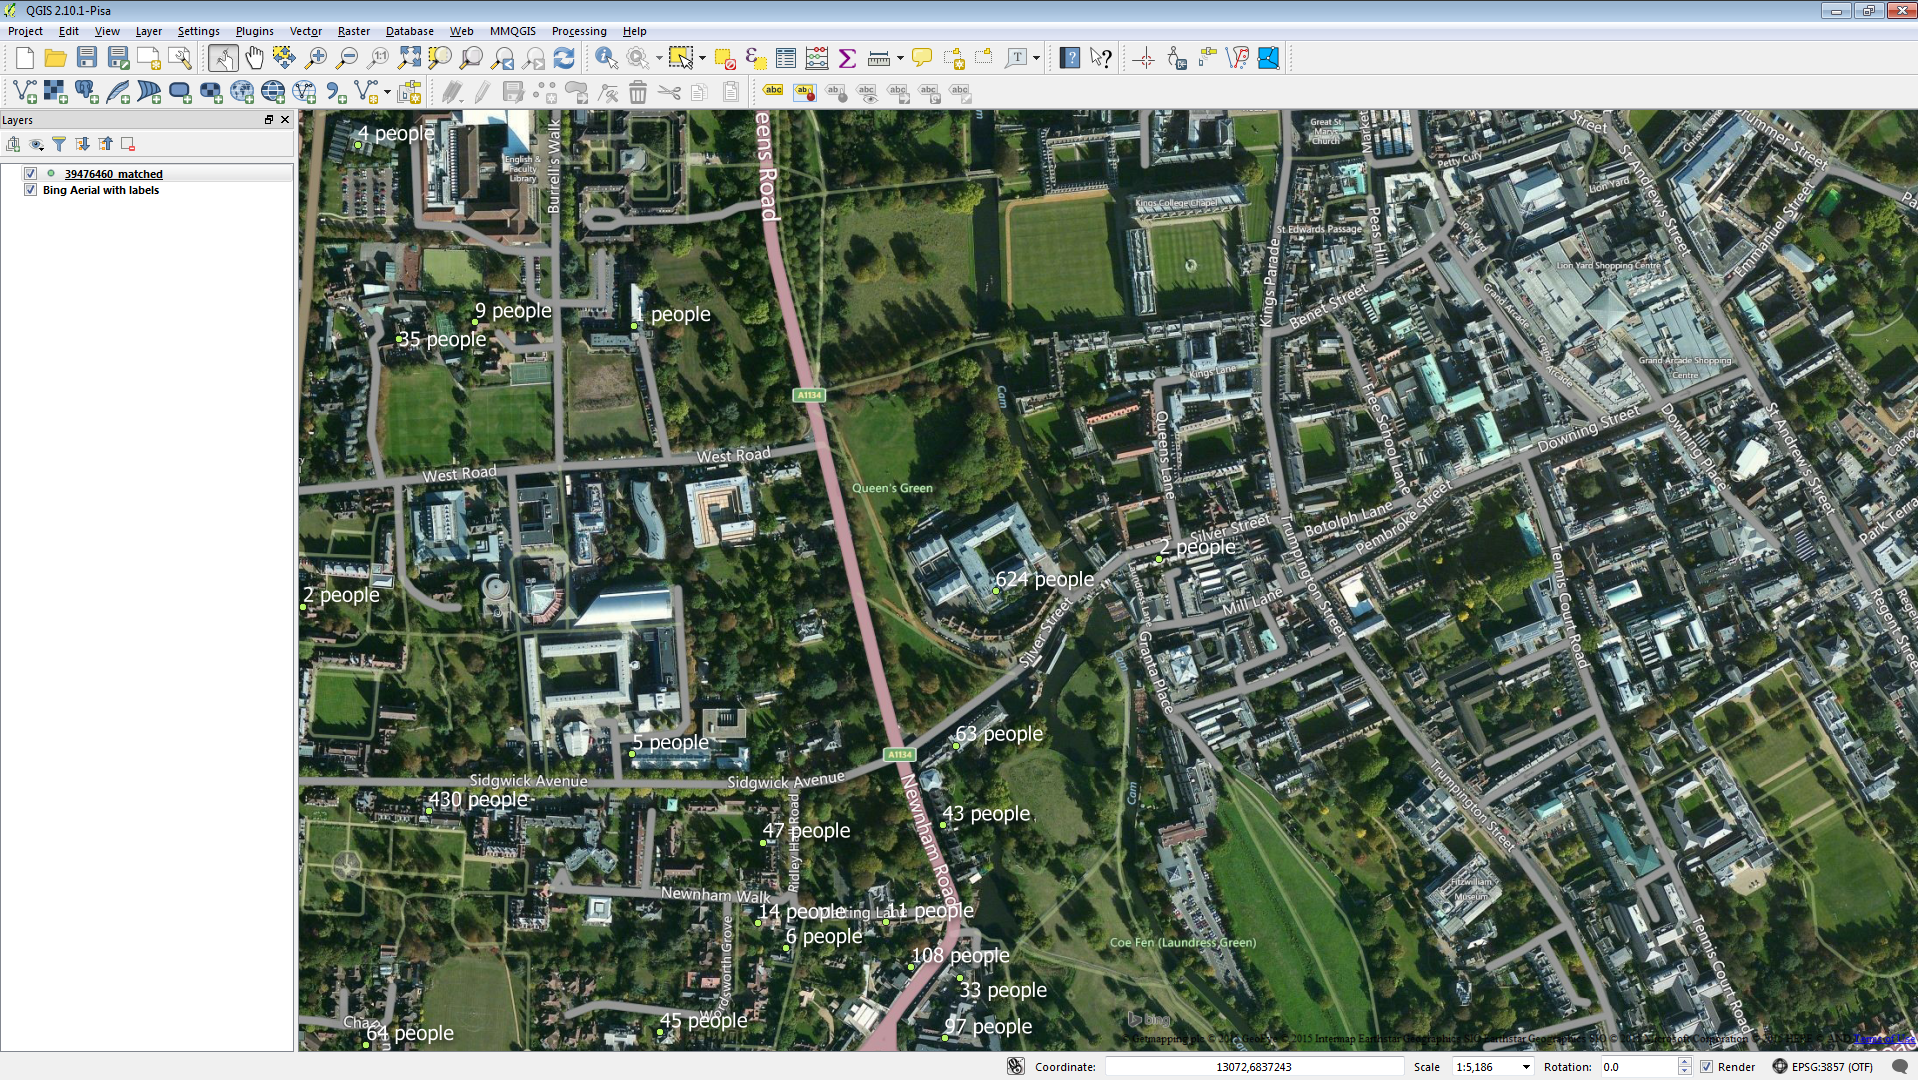
- In the next box, you can type "concat(Population,' people')" and click 'Apply'.
- Alternatively, you can choose an option from the dropdown box or click the Expressions button at the end of the dropdown box (ε) to build your own.
- It is recommended to change the colour and size of the labels to make them more legible. Select 'Text' in the sub-left-hand pane and change the font size to 15 and the colour to white.
- You can also select 'Shadow' from the sub-left-hand pane check 'Draw drop shadow'.
- Click 'OK' to apply and view your changes.
If you zoom in slightly on the bottom-right corner of the map using your scroll wheel, you will be able to see one postcode that contains 624 people (which are the student halls at Queens' College, University of Cambridge) whereas just down the road on Silver Street, there is a postcode that only contains 2 people.